Leading Data Visualization Services & Consulting Company
From strategy to implementation, we help enterprises visualize data effectively. Our consulting services ensure meaningful, interactive, and insightful dashboards that drive growth and operational efficiency.
Book a Free Demo Now
Overview
Who We Are – Trusted Data Visualization Experts
Digiprima is a trusted data visualization services and consulting company, helping enterprises convert complex data into actionable insights. As a Microsoft Gold Partner and AWS Select Tier provider, we have delivered 600+ successful visualization projects across industries, including healthcare, finance, retail, and manufacturing. Our team of 120+ certified BI and analytics specialists, including 8 PhDs, develops interactive dashboards, reports, and visual analytics tools tailored to business needs. We have processed over $1.2B in business data, enabling clients to make faster, smarter decisions with measurable outcomes. Recognized by Clutch and other independent review platforms for consistent delivery, we maintain a 4.8/5 client satisfaction rating and a 90% retention rate—proving our solutions are not only effective but trusted by enterprises worldwide.

Brands
Digiprima is trusted and loved by


Why Choose Us
Why Choose DigiPrima? Data Visualization Specialists
We specialize in transforming complex data into clear, compelling visuals that empower smarter decisions. With a team of certified experts in Tableau, Power BI, and cloud-based visualization tools, DigiPrima delivers solutions that drive business impact. In the past year, we:
- 400+ interactive dashboards designed
- 90+ global enterprises achieved enhanced reporting efficiency
- 70% boost in user adoption rates
- 50% reduction in reporting time
Let us help you tell your data story with clarity and confidence.
Why Needs Us
Why Your Enterprise Needs Data Visualization Experts
In today’s data-driven world, most enterprises struggle to interpret and leverage raw data effectively. Without proper visualization strategies, insights remain hidden in spreadsheets, dashboards are underutilized, and decision-making slows. Partnering with a trusted Data Visualization Services & Consulting Company like DigiPrima transforms raw data into actionable visual insights that improve business performance, optimize operations, and uncover growth opportunities.
Gain Instant Clarity
We create interactive dashboards and reports that provide real-time visibility into sales trends, customer behavior, and operational performance, enabling faster, smarter decisions.
Streamline Reporting
Our solutions automate repetitive reporting tasks and consolidate scattered data sources, reducing manual effort by up to 65% and improving accuracy across departments.
Accelerate Decision-Making
On-demand visualizations allow teams to access insights instantly, accelerating time-to-decision by up to 50% and driving competitive advantage.
Ensure Data Accuracy
We implement robust data governance and validation frameworks, ensuring reliable and accurate visualizations that stakeholders can trust.
Scalable Solutions
From departmental dashboards to enterprise-wide visualization platforms, our solutions scale with your organization, supporting growth without disruption.
Compliance & Security
Our visualization frameworks follow industry standards and regulatory guidelines such as GDPR and HIPAA, keeping sensitive data secure and audit-ready.
Development Process
Our Proven Framework for Delivering Impactful Data Visualization Solutions
From strategy to deployment, our 6-phase Data Visualization development framework ensures your business data is transformed into actionable insights with clarity and precision. With 600+ successful implementations, we follow a structured process designed to reduce complexity, enhance adoption, and maximize ROI.
1. Business & Data Discovery
We start by understanding your business objectives and data landscape through stakeholder workshops and system assessments. This phase defines KPIs, reporting needs, and visualization goals tailored to your enterprise.
2. Data Assessment & Preparation
Our team evaluates your datasets for completeness, quality, and consistency. Data cleansing, normalization, and enrichment prepare the information for accurate and efficient visualization.
3. Visualization Architecture & Design
We create robust visualization models and scalable architectures that support interactive dashboards, real-time reporting, and flexible drill-down capabilities, ensuring insights are accessible across the organization.
4. Dashboard & Report Development
Intuitive dashboards and custom reports are developed with advanced visual design principles, enabling users to monitor trends, track performance, and make informed decisions quickly.
5. System Integration & Deployment
Our solutions are integrated seamlessly with ERP, CRM, and other enterprise systems using secure APIs and connectors, ensuring real-time data flow and consistency.
6. Continuous Optimization & Support
Post-deployment, we provide ongoing monitoring, updates, and enhancements. Performance is tracked, dashboards are refined, and new visualizations are added to align with evolving business needs.
Why 500+ Clients Choose Digiprima?
40%
Average Cost Savings
70%
Faster Deployments
5X
Client ROI
40+
Countries Served
Customer Stories
Why Clients Love Working with Digiprima
From seamless project execution to ongoing support, our clients share what sets us apart as their trusted technology partner.


Solutions
Modern Data Visualization Solutions That Empower Smarter Decisions
Digiprima’s Data Visualization Services & Consulting Company helps enterprises transform raw data into actionable insights with modern, cutting-edge solutions. Our approach goes beyond traditional dashboards, enabling real-time analytics, predictive insights, and AI-assisted visualizations that drive faster, smarter decision-making. With 600+ successful projects, we help organizations monitor KPIs, optimize operations, and uncover opportunities with clarity and precision.
Interactive & Real-Time Dashboards
Gain instant visibility into key metrics, trends, and performance indicators. Our dashboards offer live data updates, dynamic filtering, and drill-down capabilities for agile, informed decision-making.
Read MoreSelf-Service Visualization Tools
Empower business users to create reports, charts, and dashboards independently. Reduce IT dependency while accelerating analytics adoption across departments.
Read MoreAI-Powered & Augmented Analytics
Leverage AI and machine learning to detect trends, anomalies, and insights automatically. Our solutions suggest optimal visualizations and highlight actionable patterns for non-technical users.
Read MoreEmbedded Visualization
Integrate visual analytics directly into ERP, CRM, or finance applications. Insights appear in context, improving workflow efficiency and increasing adoption across teams.
Read MorePredictive & Prescriptive Analytics Visuals
Go beyond historical reporting. Anticipate trends, forecast outcomes, and receive actionable recommendations to proactively optimize strategies and reduce risks.
Read MoreCloud-Based & Collaborative Platforms
Access secure, scalable visualizations from anywhere. Teams can collaborate in real time, share insights, and maintain centralized governance across the organization.
Read More
Tools
Technologies and Platforms Behind Our Work


Languages


JavaScript Frameworks
.webp)


Languages


JavaScript Frameworks


Industries
Your Industry. Our Innovation. Real Results.
We speak the language of your business – and build tech to match.


Limited Free AI Audit for First 10 Clients This Month
Blogs
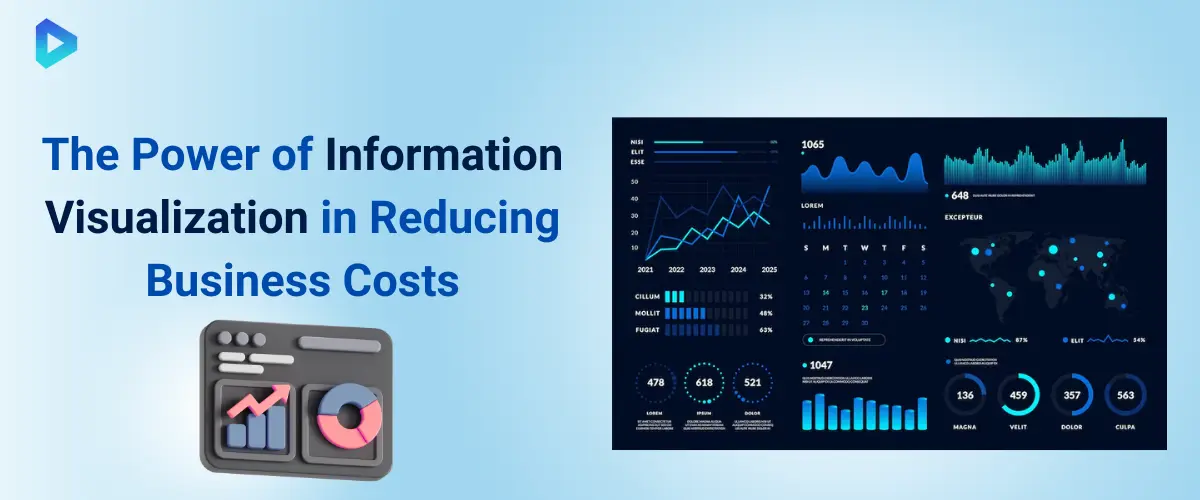
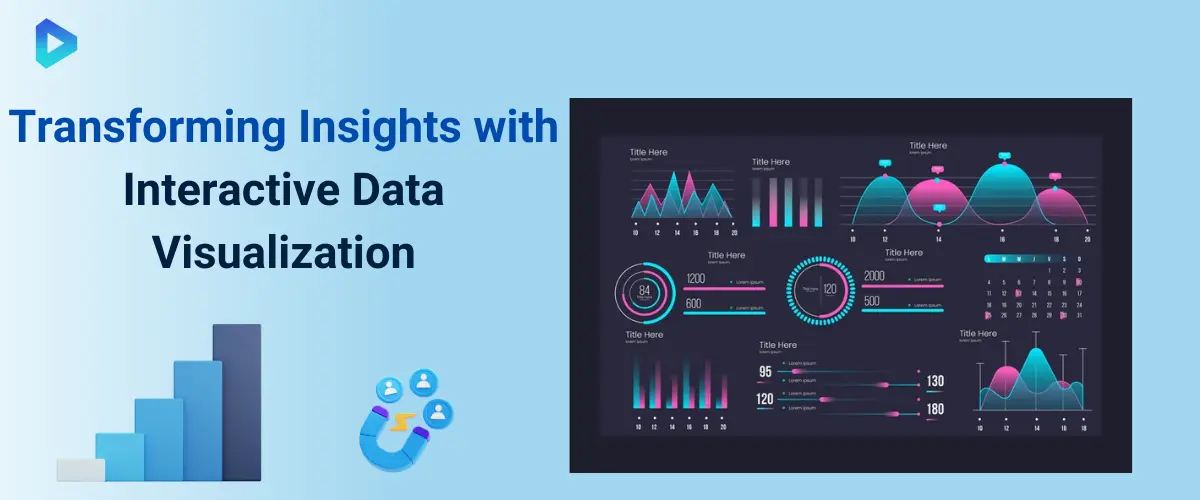
Insights & Trends in Modern Data Visualization
Stay ahead with our latest blogs on interactive dashboards, predictive analytics visuals, and AI-powered data storytelling. Learn how top enterprises turn complex data into actionable insights and discover best practices to drive smarter, data-driven decisions in 2025.


FAQ'S
Frequently Asked Questions on Data Visualization Services & Solutions
Digiprima offers end-to-end Data Visualization Services & Consulting, helping organizations turn raw data into clear, actionable insights.
Our experts design interactive dashboards, custom reports, and advanced visual analytics that empower faster, data-driven decision-making across departments.
A strong data visualization partner combines technical expertise with business insight.
With over 10 years of experience and 120+ certified visualization specialists, Digiprima delivers solutions using Tableau, Power BI, and cloud-based visualization platforms to maximize ROI and adoption.
Choose a provider with proven impact. Digiprima’s visualizations have helped clients reduce reporting time by 50%,
improve data accuracy by 90%, and gain real-time visibility into operations, enabling smarter, faster decisions.
Costs vary by complexity. Basic dashboards start at $15,000, while enterprise-scale visualization platforms may range from $80,000 to $250,000.
Digiprima provides transparent cost estimates and ROI analysis before project initiation.
Enterprises in finance, healthcare, retail, manufacturing, logistics, and technology gain significant advantages.
Digiprima tailors solutions to each industry, helping teams track KPIs, uncover trends, and drive business growth.
Traditional BI focuses on dashboards and historical reporting, while modern data visualization emphasizes interactive, real-time, and predictive visuals.
Digiprima integrates both approaches, enabling businesses to monitor the present while forecasting trends effectively.