Today’s businesses generate massive amounts of data, and the ability to analyze this information in real-time is a game-changer. Real-time data visualization enables organizations to track metrics, monitor systems, and make data-driven decisions without delay.
This capability ensures that businesses respond to challenges promptly and seize opportunities as they arise. Whether it’s tracking KPIs or identifying potential risks, this technology provides clarity and confidence in decision-making. This blog will uncover how real-time data visualization transforms decision-making and fosters business agility.
Understanding the Data Visualization Process for Better Decisions
A structured data visualization process simplifies decision-making by presenting data clearly.
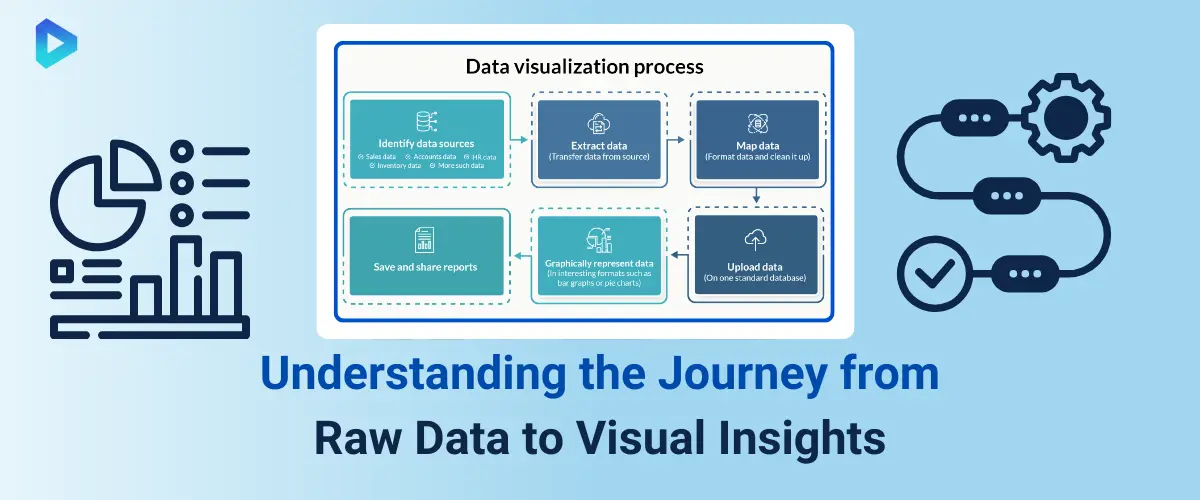 Key Steps in the Data Visualization Process
Effective data visualization starts with a structured process that transforms raw data into actionable insights. Begin by collecting accurate and relevant data. Next, clean and organize this data to eliminate inconsistencies and inaccuracies.
Use visual elements like charts, graphs, and heatmaps to represent data effectively. Finally, ensure the visualization aligns with your business objectives for optimal clarity. These steps empower decision-makers by presenting information clearly and concisely, paving the way for smarter decisions.
Simplifying Data Representation for Clearer Insights
Clear data representation is crucial for understanding complex datasets. Simplify data by focusing on key metrics that align with your goals.
Use visual aids like bar charts for comparisons or line graphs for trends. Avoid clutter by presenting only essential information.
Modern tools offer templates and customization options to enhance readability and comprehension. By simplifying data representation, stakeholders can grasp critical insights faster, leading to more decisive actions and improved outcomes.
How the Process Enables Informed Decision-Making
The data visualization process bridges the gap between raw data and strategic decisions. Visual tools make patterns and correlations easier to identify.
By using this process, decision-makers can rely on visual evidence rather than intuition. For example, trend analysis can predict future outcomes, while performance dashboards track ongoing metrics. This enables businesses to make proactive, informed decisions that drive growth, minimize risks, and enhance overall efficiency.
Real-Time Data Flow Visualization for Instant Insights
Visualizing real-time data flow empowers businesses to act swiftly and effectively.
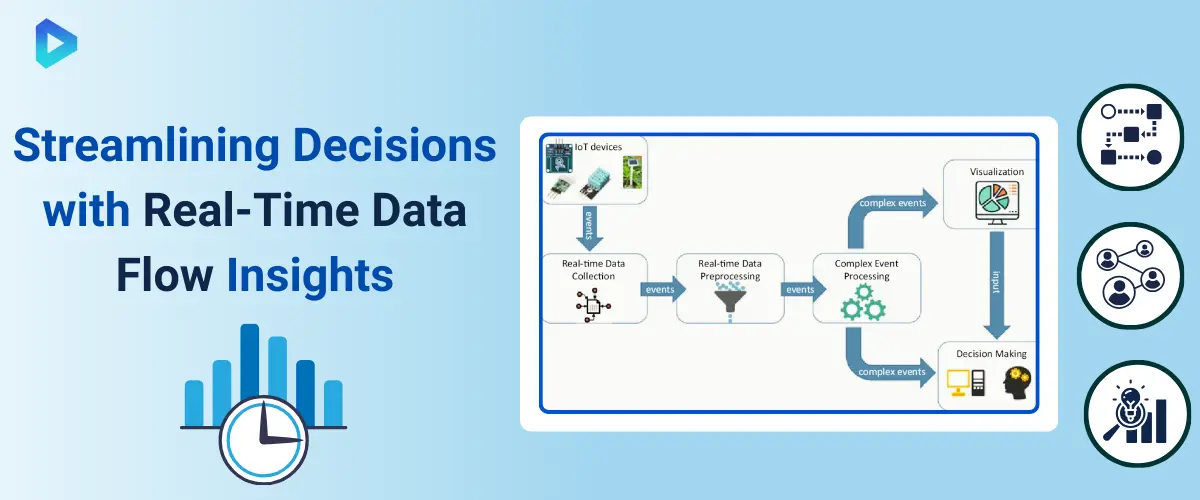 Exploring Real-Time Data Flow in Complex Systems
Real-time data flow in complex systems is a vital element for modern analytics. It involves capturing, processing, and visualizing data streams as they occur.
For example, sensors in IoT devices continuously generate data that requires immediate analysis to monitor performance or detect anomalies. Businesses benefit from such systems by identifying inefficiencies or risks promptly.
Real-time visualization tools make it easier to manage and interpret dynamic data, enabling faster responses and informed decision-making in high-pressure scenarios.
Benefits of Visualizing Data Flow in Real-Time
Visualizing real-time data flow delivers unmatched clarity and operational advantages. It improves situational awareness, enabling teams to monitor live metrics such as sales performance or network activity.
Key benefits include faster problem identification, enhanced process control, and more effective resource allocation. Industries like healthcare, manufacturing, and finance rely on real-time visualizations to make critical decisions quickly. These tools allow stakeholders to observe trends, spot irregularities, and ensure seamless operations.
Techniques for Optimizing Real-Time Data Flow Visualization
Optimizing real-time data flow visualization requires the right tools and strategies. Start by selecting software that supports high-speed data processing and interactive dashboards.
Implement techniques like filtering to focus on relevant information and reduce clutter. Use visuals like flow diagrams and heatmaps to highlight key data relationships.
Ensure data pipelines are stable and scalable to handle large volumes without delays. Continuous monitoring and updates improve accuracy and relevance, ensuring stakeholders get actionable insights when they matter most.
Effective Data Visualization Techniques for Real-Time Analytics
Mastering visualization techniques transforms raw data into actionable, real-time insights.
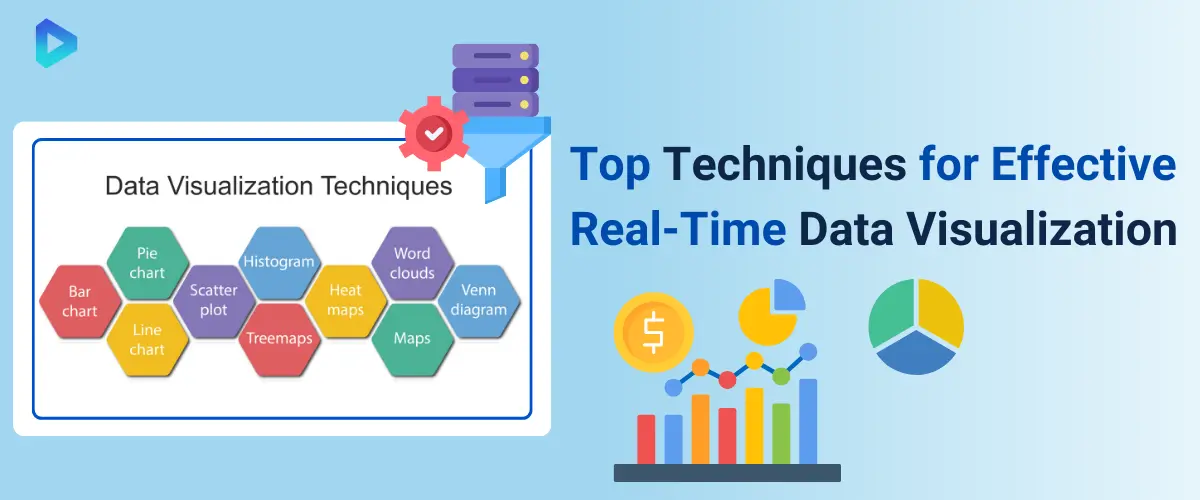 Key Techniques to Improve Real-Time Data Visualization
Using effective techniques enhances clarity and comprehension in real-time data visualization. Employ color coding to highlight patterns or trends, ensuring that critical data points stand out.
Interactive elements such as tooltips, zooming, or filters improve user engagement and provide on-demand granularity. Select appropriate chart types like line graphs for trends, heatmaps for density, or scatter plots for correlations.
Simplify layouts by eliminating unnecessary design elements, prioritizing clarity over aesthetics. Incorporate dynamic updates with real-time data feeds to maintain relevance.
Ensure responsiveness for accessibility across devices. Combining these strategies results in intuitive visualizations that support swift decision-making in fast-paced environments.
How Visualization Techniques Aid Decision-Making
Visualization techniques bridge the gap between complex datasets and actionable insights. Simplified representations like dashboards or key performance indicators (KPIs) ensure quick comprehension of data trends.
Techniques such as clustering and aggregation distill large datasets into digestible segments, spotlighting anomalies or patterns. Predictive overlays, like forecasting lines or probability bands, offer future-oriented insights, aligning with strategic goals.
Interactive designs empower users to drill down into specific data layers, encouraging informed decisions. These approaches reduce cognitive overload, enabling businesses to respond rapidly and accurately to real-time scenarios. Decision-making benefits from reduced ambiguity and increased confidence in data-driven choices.
Combining Data Visualization and Predictive Analysis
Integrating predictive analysis with visualization techniques amplifies real-time decision-making capabilities. Begin by layering predictive models over existing datasets to identify trends or future outcomes.
Utilize advanced visualization types like decision trees or probability graphs to illustrate scenarios. Combine real-time dashboards with predictive elements, such as projected growth trajectories or risk assessments.
Ensure visualizations update dynamically as new data is processed, maintaining the accuracy of predictions. Interactive tools allow users to test “what-if” scenarios by adjusting variables in real-time. This synergy of prediction and visualization fosters proactive decision-making, equipping businesses to anticipate changes and respond strategically.
Real-Time Data Visualization Tools for Enhanced Insights
Explore tools designed to transform real-time data into actionable insights.
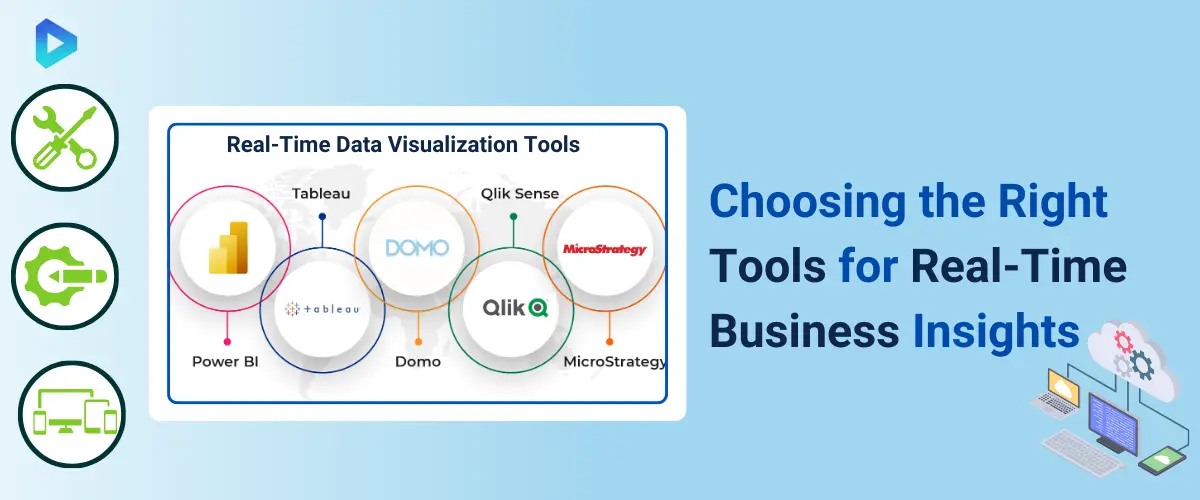 Features to Look for in Visualization Tools
Choosing the right real-time data visualization tool requires knowing the essential features. Key functionalities include interactive dashboards, seamless data integration, and advanced filtering options.
Tools with cross-platform compatibility ensure accessibility on mobile, desktop, and cloud. Look for tools offering customization to tailor visualizations to specific business needs.
Real-time alerts and reporting features are critical for timely decision-making. Security and scalability are also vital, ensuring tools can handle sensitive data and grow alongside your business. User-friendly interfaces further streamline the adoption process across teams.
Top Real-Time Data Visualization Tools in 2025
The latest visualization tools in 2025 offer advanced capabilities for real-time insights. Leading platforms include Tableau, Power BI, and Google Data Studio, renowned for their robust integration and visualization features.
Tools like Grafana excel in monitoring IT infrastructures, while Looker specializes in business-centric insights. Advanced AI-driven tools such as Sisense provide predictive analytics alongside visualization.
Emerging solutions emphasize automation and real-time data synchronization, enabling companies to stay ahead in dynamic industries. The versatility and adaptability of these tools make them essential for modern businesses.
Comparing Paid and Free Visualization Tools
Selecting between paid and free visualization tools depends on your business needs and budget. Paid tools like Tableau and Power BI provide extensive features, including advanced analytics, scalability, and robust customer support.
Free options, such as Google Data Studio or Kibana, offer basic functionalities and can suffice for smaller-scale projects. However, they may lack advanced integrations and customizations. Paid tools are ideal for large enterprises requiring end-to-end solutions, while free tools cater to startups or organizations exploring data visualization with limited resources. Assessing your goals helps determine the best fit.
Unity Real-Time Data Visualization for Interactive Displays
Harness Unity's power to create dynamic and engaging data displays.
 How Unity Enhances Real-Time Data Visualization
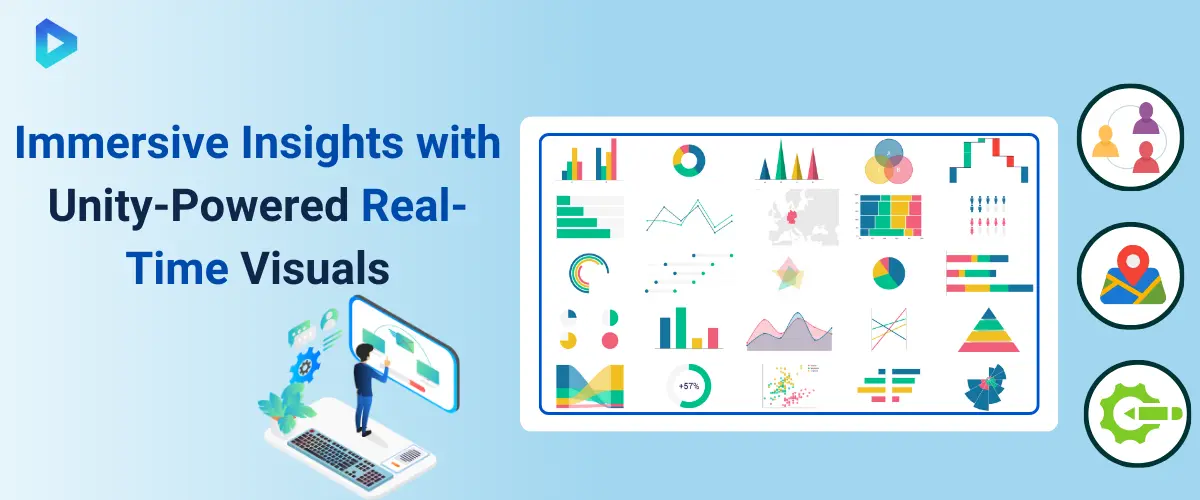
Unity offers advanced tools for crafting real-time, visually immersive data experiences. With its robust engine, developers can integrate live data feeds seamlessly into 3D environments.
Unity’s versatility allows users to design custom dashboards, interactive charts, and virtual data presentations. Features such as animation support and real-time rendering make data more engaging and easier to interpret.
Its compatibility with IoT devices and APIs ensures smooth data integration across platforms. Unity’s intuitive UI and scripting capabilities empower businesses to transform complex datasets into accessible visual narratives.
Applications of Unity in Visualizing Complex Data
Unity finds extensive use in industries requiring detailed data interpretations. For healthcare, it powers real-time patient monitoring dashboards with 3D visuals.
In engineering, Unity supports intricate simulations, visualizing performance metrics in real time. Financial sectors utilize Unity to display market trends interactively, enabling quick decisions.
Urban planning benefits from Unity's ability to showcase real-time environmental or traffic data in 3D models. Its gaming roots also make it ideal for educational tools, visualizing learning data dynamically. Unity's adaptability bridges diverse use cases, making complex data manageable and actionable.
Benefits of Using Unity for Data Dashboards
Unity’s dashboards combine functionality with stunning visuals, elevating user experience. Its 3D capabilities allow for the creation of immersive environments, ideal for understanding intricate datasets.
Unity dashboards support real-time updates, ensuring users access the latest information instantly. They’re highly customizable, catering to specific industry needs.
Cross-platform compatibility ensures accessibility across devices like desktops, mobile, and AR/VR hardware. Unity’s performance optimization keeps dashboards efficient, even with extensive datasets. This blend of aesthetics, functionality, and real-time performance sets Unity apart for building impactful data dashboards.
Real-Time Data Display for Smarter Decision-Making
Real-time data displays offer actionable insights, enhancing decision-making and operational efficiency.
 How Real-Time Displays Improve Operational Decisions
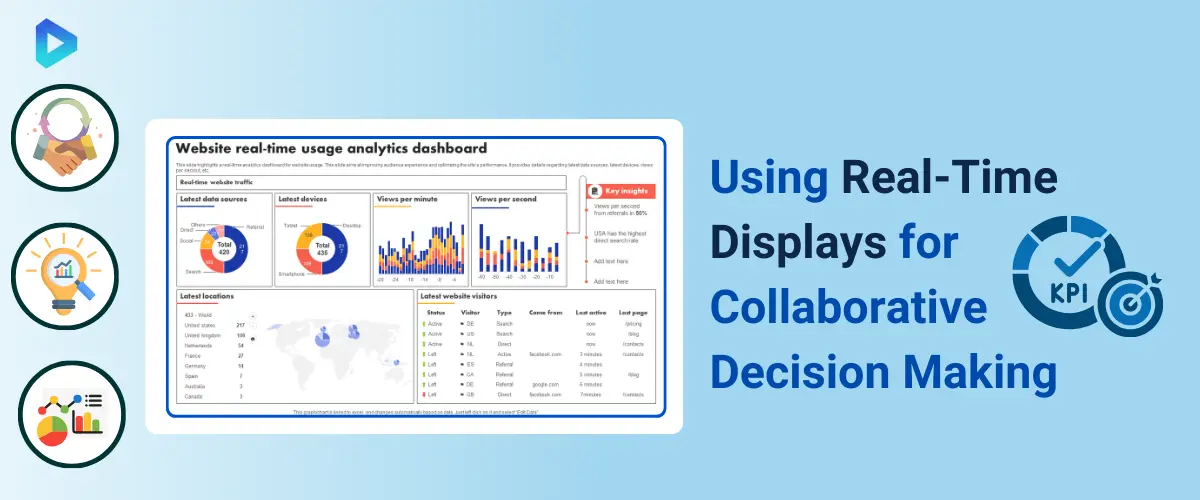
Real-time data displays empower businesses by delivering instant insights, enabling swift and precise operational decisions. By visualizing live data streams, these displays help monitor ongoing processes and identify potential issues before they escalate.
For instance, logistics companies can track fleet movement in real time to optimize routes, saving time and resources. Manufacturing facilities use real-time displays to monitor equipment performance, ensuring immediate response to anomalies.
Additionally, these displays enhance collaboration by providing teams with a unified, up-to-date data view. This real-time awareness facilitates better decisions, improves productivity, and reduces risks across various operations.
Techniques for Creating Effective Real-Time Data Displays
Designing effective real-time data displays involves combining clarity, relevance, and usability. Begin by identifying the most critical metrics to include, ensuring the display addresses specific operational needs.
Use visual elements like charts, graphs, and color coding to represent data intuitively. Implement user-friendly dashboards with customizable layouts, enabling users to focus on pertinent information.
Prioritize performance by ensuring the system processes data with minimal lag. Incorporate alerts or notifications for key thresholds or anomalies to drive prompt action. Testing and iterative improvements help refine these displays, ensuring they remain effective and adaptable to evolving business requirements.
Overcoming Challenges in Implementing Data Displays
Implementing real-time data displays can present challenges, such as managing large datasets, ensuring data accuracy, and maintaining system performance. To address these, invest in robust infrastructure that supports high-speed data processing and storage.
Use data cleansing techniques to eliminate inaccuracies, ensuring reliable displays. Additionally, integrate advanced analytics and automation to filter and present relevant insights efficiently.
User adoption may pose another challenge—offer training and intuitive interfaces to encourage seamless integration into workflows. Lastly, monitor and maintain the system to prevent downtime, ensuring displays consistently deliver value in dynamic environments.
Real-Time Data Visualization in Python for Developers
Python simplifies real-time data visualization, offering tools for seamless integration and customization.
 Python Libraries for Real-Time Data Visualization
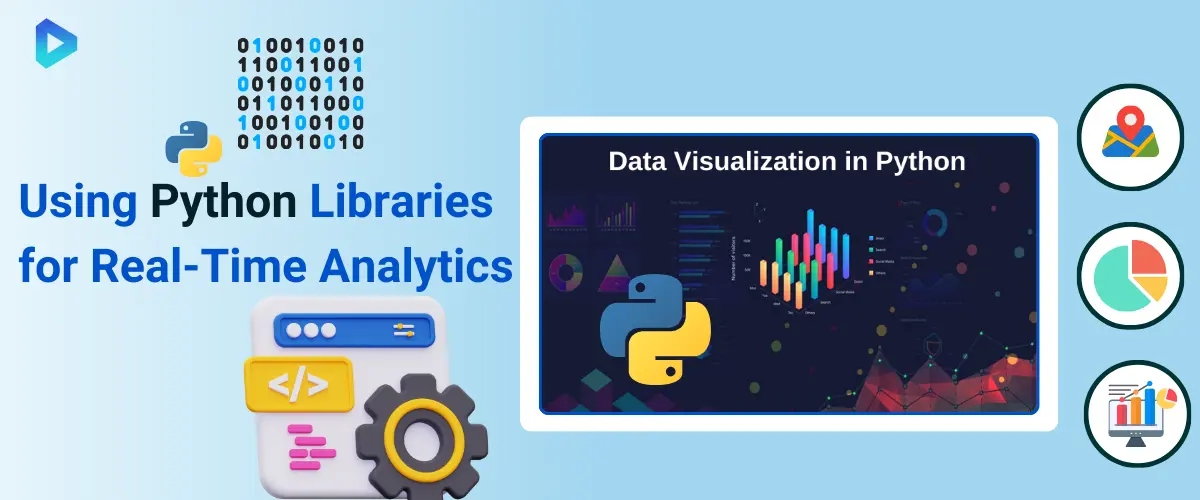
Python offers robust libraries to create real-time data visualizations, catering to various needs. Libraries like Matplotlib and Seaborn provide foundational tools for crafting visual elements, while Plotly and Dash excel at building interactive, web-based dashboards.
For high-performance data streaming, Bokeh and Altair deliver dynamic visualizations with user-friendly syntax. Developers needing 3D visualization capabilities can utilize VisPy or Mayavi.
Additionally, Pandas integrates seamlessly with visualization libraries for data preparation, enabling efficient workflows. These tools are open-source, ensuring flexibility for developers to modify and tailor visualizations for specific real-time applications. Choosing the right library depends on project complexity, scalability needs, and intended audience.
Steps to Build Real-Time Visualizations with Python
Creating real-time data visualizations in Python involves a structured approach. Start by importing and preparing the data using Pandas or similar libraries. Next, choose an appropriate visualization library such as Bokeh or Plotly based on your requirements.
Establish real-time data streaming by integrating APIs or WebSockets. Design intuitive dashboards with essential visual components like line graphs, bar charts, or heatmaps.
Use interactivity features such as tooltips, filters, or zoom options to enhance user engagement. Test the visualization to ensure performance and scalability in high-data environments.
Finally, deploy the solution on a cloud platform or local server for broader accessibility. Regular updates and performance monitoring ensure the visualization meets dynamic demands.
How Python Supports Custom Real-Time Dashboards
Python empowers developers to design highly customized dashboards for real-time data visualization. With frameworks like Dash and Streamlit, creating interactive, web-based dashboards becomes efficient and intuitive.
These frameworks allow embedding visual elements like charts, maps, and tables while supporting complex callbacks for interactivity. Developers can integrate real-time data sources using WebSocket protocols or APIs, ensuring dashboards update dynamically.
Customization options include themes, layouts, and user-specific features like role-based views or data filters. By leveraging Python’s ecosystem of libraries and tools, businesses can achieve tailored dashboards that align with operational needs, enhancing real-time decision-making and user experience.


Let's Discuss Your Idea!
Send us your request using the form below.
Contact Info
Our contacts
Thank You!
We will respond to you within 24 hours.