Efficient inventory management is essential for keeping operations running smoothly and maintaining high levels of customer satisfaction. With Power BI dashboards, businesses can gain real-time insights into stock levels, product demand, and supply chain performance.
This powerful tool enables companies to visualize data, track trends, and make informed decisions that optimize inventory flow and reduce inefficiencies. By leveraging Power BI for inventory management, businesses can enhance efficiency, minimize stock shortages or overages, and improve overall operational performance.
In this blog, we'll explore how Power BI dashboards streamline inventory management processes, providing key benefits and actionable insights that drive better decision-making and ultimately boost business growth.
Utilizing Power BI Dashboard for Efficient Inventory Management
Power BI dashboards are essential for businesses aiming to improve inventory management by providing real-time insights, streamlined data, and advanced tracking capabilities.
 Key Features of Power BI Inventory Management Dashboards
Power BI dashboards offer crucial features for effective inventory management, including real-time data tracking, allowing businesses to monitor stock levels accurately. With customizable views, users can focus on inventory metrics such as stock turnover rates and replenishment schedules. Additionally, the drag-and-drop interface makes it easy to organize data into visual reports that are easy to interpret. Power BI’s ability to integrate with multiple data sources ensures a unified inventory system, consolidating data from warehouses, suppliers, and sales channels.
Customizing Power BI Dashboards for Real-Time Inventory Insights
Customizing Power BI dashboards for real-time inventory insights allows businesses to tailor the tool to their specific needs. By setting up custom filters and alerts, users can receive updates on stock levels, product shortages, or overstock situations instantly. Integrating live data streams from warehouse management systems or point-of-sale systems ensures inventory data remains up-to-date. Visualizations such as heat maps and bar charts can be customized to highlight key inventory metrics, giving stakeholders a clear view of stock status across multiple locations.
How Power BI Dashboards Improve Inventory Tracking
Power BI dashboards improve inventory tracking by consolidating data from multiple sources into a single, easy-to-navigate platform. With real-time tracking capabilities, businesses can monitor stock levels, predict demand, and avoid stockouts or overstocking. The dashboard’s ability to analyze historical data enables users to forecast inventory needs more accurately. Interactive charts and reports also allow users to drill down into specific inventory details, ensuring more efficient stock control and faster decision-making. The dashboards’ ability to automate reports saves time and reduces the risk of errors in manual data entry.
Power BI Data Analysis for In-Depth Inventory Monitoring
Power BI's advanced data analysis tools give businesses real-time insights into inventory levels, trends, and performance metrics, ensuring optimal stock management and decision-making.
 Benefits of Power BI for Data-Driven Inventory Analysis
Power BI offers substantial benefits for inventory analysis by transforming raw data into actionable insights. With the ability to integrate multiple data sources, Power BI consolidates inventory information from suppliers, sales platforms, and warehouses. This helps businesses make data-driven decisions, reducing stockouts and overstock issues. Additionally, its real-time reporting allows for quick identification of inventory discrepancies and optimization opportunities, ensuring that businesses maintain balanced stock levels while minimizing holding costs.
Using Power BI to Visualize Inventory Trends and Patterns
Power BI helps users visualize inventory trends by providing dynamic dashboards and customizable reports. Businesses can easily track seasonal demand fluctuations, product turnover rates, and supplier lead times. Visualizations like line graphs, bar charts, and heat maps make it simple to spot patterns over time, allowing for more accurate forecasting. By drilling down into specific inventory categories, businesses can identify underperforming or overstocked items and adjust their purchasing strategies accordingly, leading to better inventory balance.
Enhancing Inventory Control with Power BI Data Analysis Tools
Power BI enhances inventory control by offering tools that monitor stock levels in real-time and forecast future demand. Companies can implement automated alerts for low inventory or expired items, allowing for proactive management of stock levels. The ability to segment data by product category, location, or supplier helps businesses refine their inventory processes, reducing waste and improving efficiency. Power BI’s integration with existing warehouse management systems allows for seamless tracking and control across multiple sites, ensuring a unified view of all inventory operations.
Inventory Management and Analysis Using Power BI Solutions
Power BI offers comprehensive solutions for businesses to manage and analyze their inventory efficiently, enabling real-time data-driven decisions and insights.
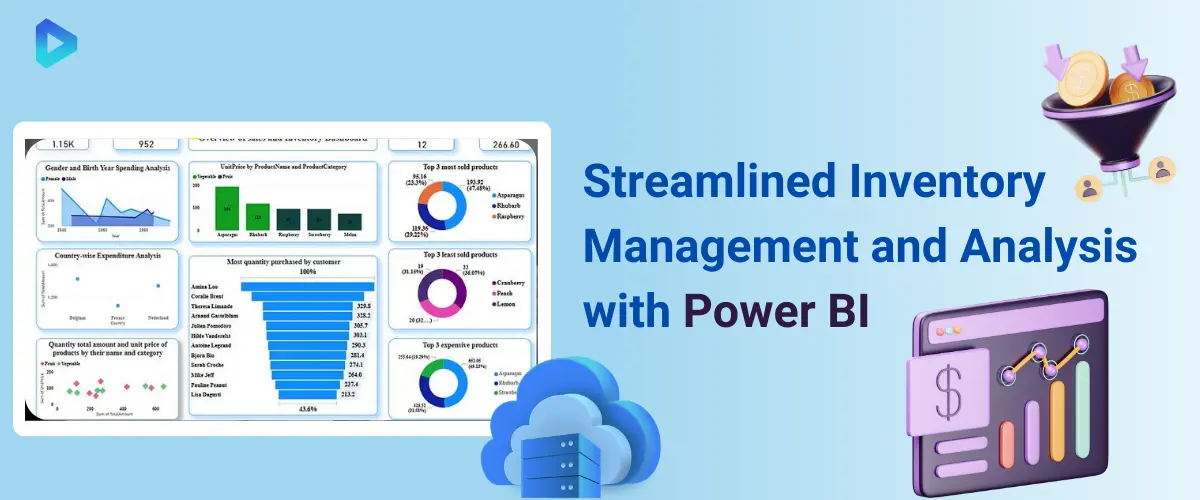 Streamlining Inventory Management with Power BI
Power BI simplifies inventory management by offering a centralized platform that consolidates data from various sources, such as warehouses, sales systems, and suppliers. Businesses can automate tasks like inventory tracking and order management, reducing the manual effort involved in these processes.
With Power BI, users can create dynamic inventory dashboards to monitor stock levels, track reordering points, and gain insights into fast-moving or slow-moving products. This streamlined approach helps minimize stockouts and overstock situations, leading to improved inventory control and operational efficiency.
Analyzing Inventory Performance Using Power BI Dashboards
Power BI dashboards allow businesses to conduct an in-depth inventory performance analysis by visualizing data trends such as product turnover rates and stock age. With real-time insights, companies can identify which items are in demand and underperforming, allowing for informed purchasing decisions. Power BI’s customizable reports make analyzing performance by product category, location, or vendor easy, helping businesses optimize their stock levels based on past sales data and future demand predictions. This level of analysis ensures better inventory forecasting and resource allocation.
Best Practices for Integrating Power BI in Inventory Management
To successfully integrate Power BI into inventory management processes, businesses should start by ensuring seamless data integration from existing systems like ERP or warehouse management systems. Set up automated alerts for critical stock levels or product expiration dates, which will help maintain optimal inventory levels. Customize dashboards to focus on the most relevant metrics for your business, such as inventory turnover or supplier lead time. Regularly updating and refining these dashboards will ensure that they continue to align with evolving business needs and provide actionable insights for efficient inventory management.
Power BI Inventory Aging Report: Optimizing Stock Management
The Power BI Inventory Aging Report offers businesses a powerful tool to optimize stock management by tracking inventory aging, ensuring efficient stock rotation, and reducing excess stock.
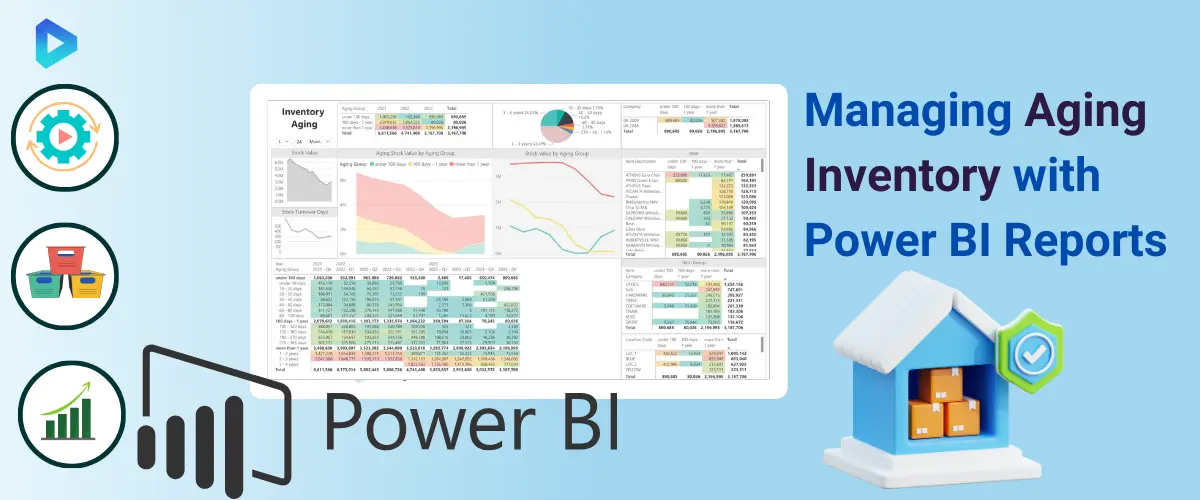 How Power BI Inventory Aging Reports Reduce Excess Stock
Power BI’s Inventory Aging Reports provide insights into how long products have been sitting in stock. By identifying slow-moving or obsolete inventory, businesses can take steps to prevent stockpiling and reduce excess inventory. The report breaks down inventory by age categories (e.g., 0-30 days, 31-60 days, etc.), helping businesses determine which products are nearing expiration or are no longer in demand. With these insights, businesses can implement discounting strategies or adjust reordering processes to optimize stock levels and avoid holding unnecessary inventory, thus reducing storage costs.
Tracking Inventory Aging and Movement with the Power BI Tool
Using Power BI’s tracking tools, businesses can monitor inventory aging and movement to better understand stock flow over time. The dashboard offers real-time updates on which items are moving quickly and which are stagnating in warehouses. By visualizing inventory movement patterns, businesses can align their stock levels with market demand, ensuring that inventory is continuously flowing. Additionally, tracking aging helps companies avoid stock that might depreciate, enabling more accurate decision-making about stock replenishment and product lifecycle management.
Using Aging Reports in Power BI to Improve Stock Rotation
Power BI aging reports facilitate better stock rotation practices by ensuring that older inventory is sold first (FIFO method), preventing the buildup of obsolete or expired products. By setting up automated alerts when inventory reaches a certain age, businesses can initiate stock rotation measures early on. These reports help prioritize the sale of older stock before replenishing with newer stock, ensuring better inventory turnover and reducing the risk of waste. With Power BI’s ability to customize the aging parameters, companies can fine-tune their stock rotation strategies for maximum efficiency.
Leveraging Power BI for Warehouse Management System Efficiency
Power BI offers comprehensive solutions for optimizing warehouse operations, providing real-time visibility, data-driven decision-making, and streamlined management across multiple warehouse locations 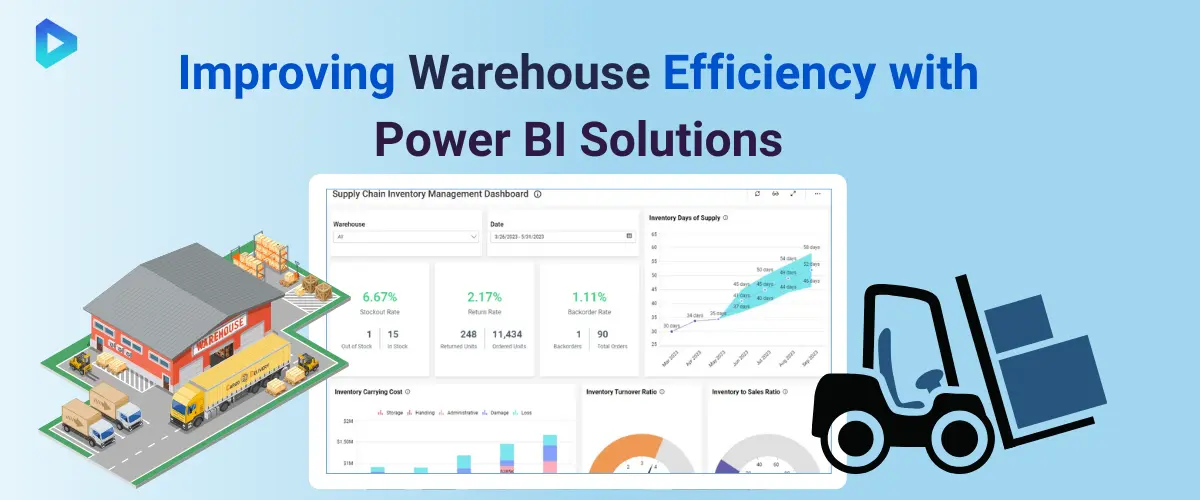
Enhancing Warehouse Operations with Power BI Insights
Power BI enables businesses to enhance warehouse operations by visualizing and analyzing warehouse data in real-time. Businesses can track key metrics such as inventory movement, picking accuracy, and warehouse productivity using customized dashboards. Power BI’s integration with warehouse management systems (WMS) provides detailed insights into operational efficiency, helping businesses identify bottlenecks, improve order fulfillment rates, and reduce labor costs. By leveraging Power BI’s data analytics capabilities, warehouse managers can make informed decisions that enhance overall performance.
Managing Inventory Across Warehouses Using Power BI
Power BI helps businesses manage inventory across multiple warehouse locations by offering a unified view of stock levels, movement, and replenishment needs. With its real-time tracking capabilities, businesses can monitor inventory flow between warehouses, ensuring efficient stock distribution and minimizing the risk of stockouts or overstocking. Power BI dashboards allow users to analyze warehouse performance, identify underperforming sites, and optimize inventory allocation across different regions, resulting in more effective stock management and cost savings.
Power BI Integration with Warehouse Management Systems for Better Control
Power BI integrates seamlessly with Warehouse Management Systems (WMS), offering businesses greater control over their warehouse operations. This integration enables businesses to track key warehouse activities such as receiving, picking, packing, and shipping in real-time, providing complete visibility into the supply chain. Power BI’s advanced analytics and reporting tools allow businesses to monitor warehouse KPIs, streamline workflows, and enhance inventory control. The integration of Power BI with WMS ensures data accuracy, reduces manual processes, and supports more strategic decision-making for optimized warehouse performance.


Let's Discuss Your Idea!
Send us your request using the form below.
Contact Info
Our contacts
Thank You!
We will respond to you within 24 hours.