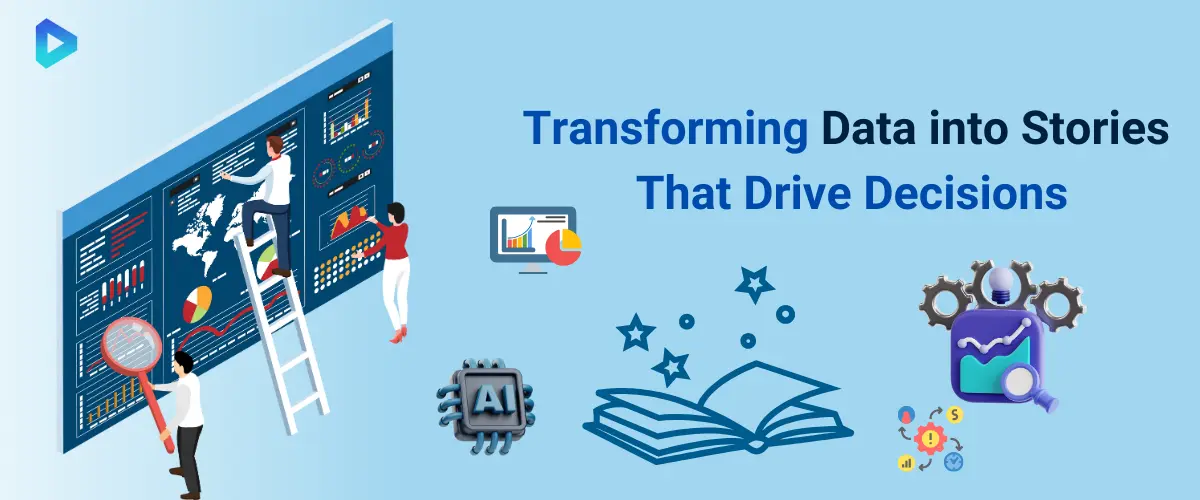

The ability to analyze data is immensely valuable, but presenting it effectively holds even greater importance. In a world overflowing with information, data storytelling bridges the gap between raw numbers and actionable insights.
By transforming complex datasets into relatable and engaging narratives, businesses can make it easier for stakeholders to comprehend trends, patterns, and implications. Data storytelling empowers decision-makers to act with clarity and confidence while fostering collaboration across teams.
In today’s data-driven environment, where decisions rely heavily on analytics, storytelling is key to simplifying complexity, communicating ideas clearly, and building stronger connections with audiences. This blog explores the growing importance of data storytelling as an indispensable tool for achieving success in today’s highly competitive landscape.
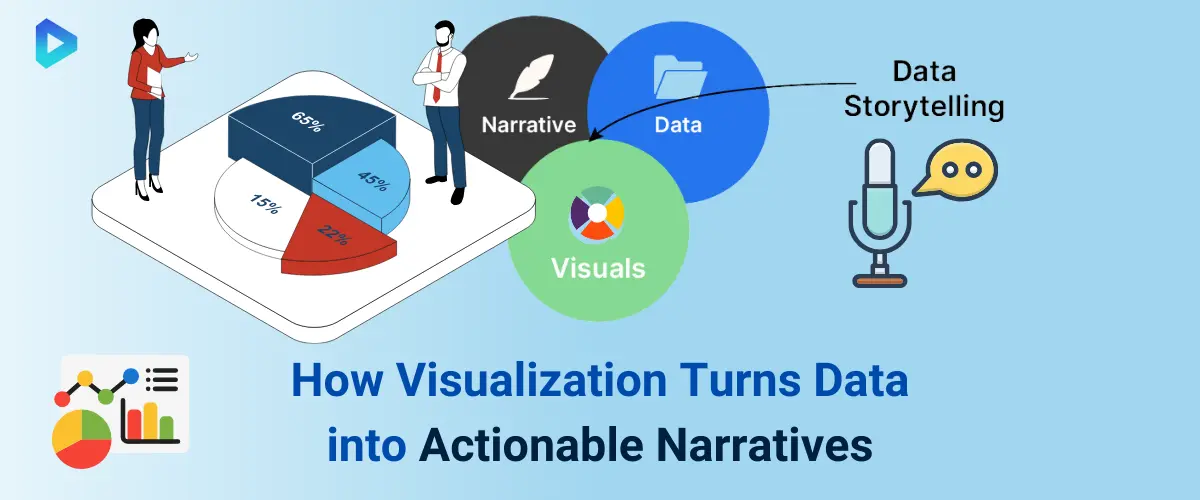
Exploring the Role of Data Storytelling Visualization
Data storytelling visualization bridges the gap between numbers and understanding, making complex data accessible.
 Why Visualization Matters in Crafting Data-Driven Narratives
Visualization transforms raw data into impactful stories by providing clarity and context. Charts, graphs, and infographics make patterns recognizable, offering quick insights without extensive explanations.
Data-driven narratives rely on visuals to convey relationships, trends, and comparisons effectively. For businesses, visualization isn’t just aesthetic—it’s a tool to engage stakeholders and drive decisions.
Whether it’s highlighting sales growth or predicting market trends, visualization adds credibility to storytelling, ensuring that insights resonate with diverse audiences. By integrating visuals, data narratives become more relatable and actionable, empowering decision-makers to move from analysis to action confidently.
Best Practices for Effective Data Storytelling Visualization
Creating impactful data storytelling visuals requires a balance of simplicity and precision. Begin by understanding your audience and tailoring visuals to their needs.
Choose the right chart types to present specific data points—bar charts for comparisons, line graphs for trends, and scatter plots for relationships. Maintain consistency in color schemes and labels to avoid confusion.
Always prioritize clarity over complexity, ensuring that visuals support, not overshadow, the story. Use annotations and highlights sparingly to emphasize key insights.
Test the effectiveness of your visualization by seeking feedback from users, refining it to eliminate ambiguity. Adhering to these best practices ensures your storytelling resonates, driving better comprehension and action.
Overcoming Challenges in Data Visualization for Storytelling
Despite its advantages, data visualization faces hurdles like data overload and misinterpretation. Too much information can overwhelm viewers, diluting the story’s impact.
Choosing the wrong visualization format might obscure insights rather than clarify them. Ensuring data accuracy and avoiding biases in representation are also critical challenges.
To address these, businesses should invest in tools that simplify data preprocessing and visualization creation. Training teams on visualization techniques further minimizes errors.
By addressing these challenges head-on, businesses can harness the true potential of data storytelling, crafting visuals that not only inform but also inspire decisive actions.
The Power of Data Visualization & Storytelling in Modern Business
Using visuals and narratives to simplify complex data, drive decisions, and inspire action.
 How Data Visualization Enhances Storytelling Impact
Data visualization revolutionizes storytelling by offering a medium to make abstract concepts tangible. Instead of overwhelming audiences with raw data, visuals like bar charts, pie graphs, and scatter plots translate numbers into compelling narratives.
Visual storytelling is impactful because it conveys information faster and more intuitively. When combined with a relatable narrative, these visuals evoke emotions and drive better understanding.
For example, organizations use visualizations to highlight trends or forecast growth, presenting data in an engaging, actionable way. The marriage of visuals and storytelling empowers businesses to communicate persuasively, turning mere insights into decisions that inspire change and drive innovation.
Merging Visuals and Narratives for Better Decisions
The fusion of data visuals and storytelling crafts a unique pathway for effective decision-making. Visual elements such as trend lines and heatmaps highlight pivotal data points that might otherwise go unnoticed.
Narratives then provide the "why" behind the numbers, explaining their significance and offering context. For businesses, this marriage is transformative—it bridges the gap between data-driven insights and human comprehension.
Decision-makers equipped with visual narratives can interpret data with clarity and precision, fostering confidence in their choices. Through this method, storytelling doesn’t just communicate facts; it enables businesses to address challenges creatively and chart strategies that align with long-term goals.
Examples of Effective Data Visualization in Business
Organizations across industries rely on impactful data visualizations to streamline operations and identify opportunities. Retailers, for instance, use heatmaps to study foot traffic patterns and optimize store layouts.
Financial institutions leverage interactive dashboards to analyze investments, offering stakeholders real-time insights. Healthcare providers employ patient care flowcharts to simplify treatment strategies and improve outcomes.
These examples highlight how effective visualizations transform data into a catalyst for innovation. Coupled with storytelling, these visuals not only simplify data interpretation but also engage audiences, turning complex datasets into actionable business strategies. Effective visualization is no longer an option—it is a necessity in today’s data-driven world.
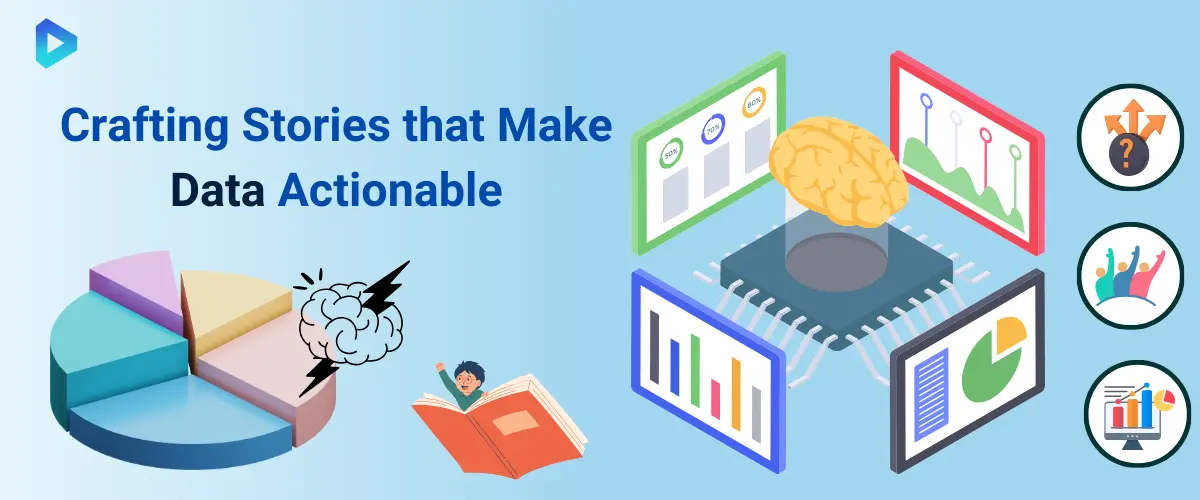
The Role of Strategic Data Storytelling in Business Growth
Strategic data storytelling empowers businesses to turn raw data into growth-driving insights.
 Why Strategy Matters in Data Storytelling
A well-planned strategy ensures data storytelling drives meaningful outcomes. It starts with identifying your audience and their needs, which dictate how data should be structured and presented.
Strategy aligns storytelling with business goals, ensuring each narrative serves a purpose—whether improving customer engagement, enhancing internal communication, or influencing decision-making. By applying strategic thinking, data becomes more than just numbers; it turns into a tool for action.
Strategic storytelling ensures your insights resonate, persuading stakeholders with clarity and purpose. The focus on strategy makes data storytelling not just descriptive but transformative, capable of driving measurable growth and innovation.
Steps to Create a Strategic Data Story
Strategic data stories follow a clear and intentional process. Begin with defining the objective—what outcome do you want from your audience?
Collect and analyze data relevant to this purpose, ensuring its accuracy and reliability. Choose visual elements like charts, graphs, or dashboards that simplify and emphasize key insights.
Craft a compelling narrative that connects these insights to business goals, keeping the story concise and focused. Test your story with a sample audience to ensure clarity and impact, and refine based on feedback. Strategic storytelling isn’t static; it evolves with new data and shifting goals, ensuring continued relevance and effectiveness.
Measuring the Impact of Strategic Data Storytelling
Tracking the success of your data storytelling efforts is essential for ongoing improvement. Define measurable objectives before sharing your story, such as increased engagement, enhanced decision-making speed, or revenue growth.
Monitor metrics like audience retention rates, the number of follow-up actions, or feedback from stakeholders. Use analytics tools to assess how your story resonates across different platforms.
Regularly compare outcomes against your goals, identifying gaps and opportunities for refinement. Effective measurement turns storytelling into a cycle of learning and optimization, ensuring your approach grows stronger over time, driving not just understanding but sustained business growth.
The Art of Data-Driven Storytelling for Better Decisions
Data-driven storytelling bridges raw data and actionable insights, enabling smarter business decisions.
 Key Elements of Data-Driven Storytelling Success
Crafting impactful data-driven stories relies on essential elements for clarity and engagement. Begin with a clear objective: what decision or action should your audience take?
Data accuracy is critical—ensure your insights are credible and reliable. Incorporate visuals like graphs or dashboards to make complex information digestible.
Context matters; connect your data to real-world scenarios or business goals. Simplify your narrative to focus on the most relevant insights, avoiding unnecessary details.
Finally, tailor your story to your audience’s needs and preferences. When these elements align, data storytelling transforms from informative to influential, driving actionable outcomes and informed decisions.
Common Challenges in Data-Driven Storytelling
While powerful, data-driven storytelling presents challenges that can hinder effectiveness. Overloading the audience with excessive data or irrelevant details can dilute the message.
Visuals that are too complex or poorly designed may confuse rather than clarify. Another issue is lacking a cohesive narrative—disconnected facts fail to drive decisions.
Additionally, understanding your audience’s level of data literacy is crucial; a technical presentation for a non-technical audience can backfire. These challenges highlight the need for thoughtful planning and execution to ensure your story engages and influences.
Overcoming Barriers with Data-Driven Storytelling Techniques
Effective storytelling techniques overcome common barriers to data-driven communication. Focus on prioritizing key insights, eliminating unnecessary information that distracts from your message.
Use intuitive visuals, like heatmaps or bar charts, to highlight trends and correlations. Leverage storytelling frameworks like the “problem-solution” approach to connect data with real-world impacts.
Regularly test your story with a sample audience to gauge its clarity and persuasiveness. Emphasize narrative flow, ensuring that each point logically builds on the previous one. These strategies ensure your data-driven storytelling resonates, turning challenges into opportunities for impactful decision-making.
Leveraging Data Storytelling AI for Smarter Decisions
Data storytelling powered by AI simplifies complex datasets into actionable and impactful insights.
 How AI Enhances the Process of Data Storytelling
Artificial Intelligence revolutionizes storytelling by automating the transformation of raw data into compelling narratives. AI tools can identify patterns, correlations, and outliers faster than traditional methods.
These tools provide real-time insights, ensuring stories are timely and relevant. Natural Language Processing (NLP) enables AI to create human-readable summaries, turning complex analytics into accessible stories.
Furthermore, AI customizes narratives based on audience needs, delivering tailored insights for stakeholders. With the ability to handle large datasets and highlight key trends, AI streamlines storytelling, making it more efficient and impactful for decision-makers.
Integrating AI with Business Analytics for Better Narrations
Combining AI with business analytics elevates the quality of data-driven storytelling. AI augments human analysis by detecting trends and anomalies that might go unnoticed.
Advanced algorithms correlate data from multiple sources, ensuring stories are comprehensive. Predictive analytics supported by AI provides foresight into future trends, enriching narratives with actionable insights.
AI also personalizes data presentation formats, from visual dashboards to detailed reports, catering to different audiences. This integration ensures businesses can narrate their data stories with clarity and precision, leading to improved strategies and outcomes.
Future Trends in AI-Powered Data Storytelling
AI is set to redefine data storytelling with emerging trends. Enhanced automation will further reduce the time needed to analyze and narrate data.
AI-powered visualizations will offer dynamic, interactive storytelling formats, allowing audiences to explore data firsthand. Integration with augmented reality (AR) and virtual reality (VR) will make storytelling immersive, turning presentations into engaging experiences.
As AI evolves, its ability to understand context and sentiment will refine narrative quality. These advancements will not only make storytelling more efficient but also empower businesses to connect with their audience on a deeper level, shaping the future of decision-making.
Crafting a Compelling Data-Driven Story for Impact
Engage decision-makers with data-driven stories that inspire action and deliver insights effectively.
 Key Elements of a Strong Data-Driven Narrative
A robust data-driven narrative combines accuracy, context, and clarity to make insights actionable. Begin with a clear purpose: define the story's goal and audience.
Use data visualizations to simplify complex datasets and emphasize key trends. Context is essential—link data to real-world scenarios that resonate with stakeholders.
Structure the story logically, leading the audience through a problem, analysis, and solution. Highlight the actionable insights and outcomes to guide decision-making. Effective storytelling bridges the gap between raw data and meaningful strategies, ensuring that the narrative drives results.
Telling Stories That Resonate with Decision-Makers
To connect with decision-makers, tailor data stories to their priorities and challenges. Understand your audience's needs and craft the narrative to address those pain points.
Use visual aids such as charts and graphs to present insights concisely. Focus on actionable recommendations supported by credible data.
Incorporate real-world examples or case studies to demonstrate relevance and feasibility. Avoid technical jargon—ensure the language is clear and accessible. By making the story relatable and relevant, you increase the likelihood of engagement and action from stakeholders.
The Role of Emotion in Data Storytelling
Emotion adds a powerful dimension to data storytelling, making insights memorable and impactful. Incorporating human elements, such as stories of success or challenges, creates empathy and connection.
Visualizations that evoke emotional responses, like the urgency of an issue or the excitement of an opportunity, drive engagement. Use color and design strategically to highlight key points and elicit desired emotions. Balancing data with emotion ensures the narrative is not only credible but also compelling, motivating decision-makers to take action.
Data Analysis, Business Analytics & Storytelling for Success
By presenting complex information in a relatable way, companies can engage stakeholders and drive informed decisions, leading to measurable success.
 The Role of Storytelling in Business Analytics
Storytelling plays a critical role in transforming raw data into meaningful insights. In business analytics, storytelling connects data points to paint a clearer picture of trends, patterns, and outcomes.
It helps bridge the gap between technical analysis and actionable strategies by delivering insights in a way that resonates with diverse audiences.
Storytelling simplifies complex datasets, making them accessible and engaging for decision-makers. By weaving a narrative around analytics, businesses can highlight opportunities, address challenges, and inspire action. Whether presenting to executives or clients, storytelling ensures that key insights are not just understood but remembered and acted upon.
Why Storytelling Is a Game-Changer for Business Growth
Storytelling in data analysis isn’t just a presentation technique—it’s a strategic advantage. It helps businesses communicate their findings effectively, making insights more impactful and relatable.
By embedding data into compelling narratives, companies can align teams, convince stakeholders, and foster trust in decisions. Storytelling drives business growth by turning insights into compelling calls to action.
Instead of overwhelming stakeholders with raw numbers, it distills essential information into clear, actionable messages. This approach encourages collaboration, empowers decision-making, and ultimately accelerates business success in a competitive environment.
Tools for Effective Business Analytics Storytelling
Effective storytelling requires the right tools to visualize and present data compellingly. Platforms like Tableau and Power BI enable businesses to create interactive dashboards and visualizations that make data easier to understand.
These tools allow users to design charts, graphs, and visuals that tell a story at a glance. Narrative-focused tools, such as Google Data Studio, help create reports that blend analytics with storytelling elements seamlessly.
For businesses leveraging predictive analytics, platforms like Alteryx integrate data analysis with workflows, enabling end-to-end storytelling. Choosing the right tools ensures that insights are not only analyzed but also presented in ways that inspire confidence and action among stakeholders.
Let's Discuss Your Idea!
Send us your request using the form below.
Contact Info
Our contacts
Thank You!
We will respond to you within 24 hours.